
Data journalism resources
Links to tutorials and other resources for data journalism. I owe a huge debt to Investigative Reporters and Editors for my own start in this area. I recommend joining IRE and taking advantage of its training — in particular at the annual National Institute for Computer-Assisted Reporting meeting.
●●●
 R, RStudio, And The Tidyverse For Data Analysis: Class at the 2018 NICAR meeting, using the dplyr package to sort, filter, join, group, and summarize data, and ggplot2 to make some simple charts.
 Mapping And Geographic Data Analysis With The Simple Features Package In R: Class at the 2023 NICAR meeting, introducing the sf package plus geocoding with the tidygeocoder package.
 Text Analysis In R: Class at the 2019 NICAR meeting, using the tidytext and quanteda packages to analyze @realDonaldTrump’s tweets and more than two centuries of State of the Union addresses.
 Learning To Love Gridded Climate Data: Panel at the 2021 NICAR meeting, introducing netCDF files, NASA’s Panoply software, and the R raster package.
 Geocoding: JSON file to obtain longitude and latitude coordinates for a simple list of addresses from Open Refine using the Bing and MapQuest Open APIs. Download from GitHub.
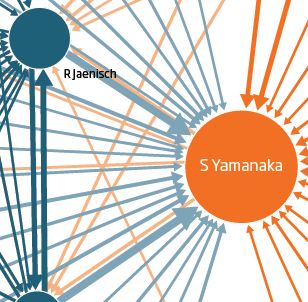 Network Analysis: Need to study and visualize connections between people or organizations? Use NodeXL or Gephi. NodeXL class at 2014 NICAR meeting, and Gephi class from 2015.
 Code Examples: View the code for my data journalism projects on GitHub.